Study on The Fertilizing Effect of Acidic Soil Modification Fertilizers

The objectives of this study were:
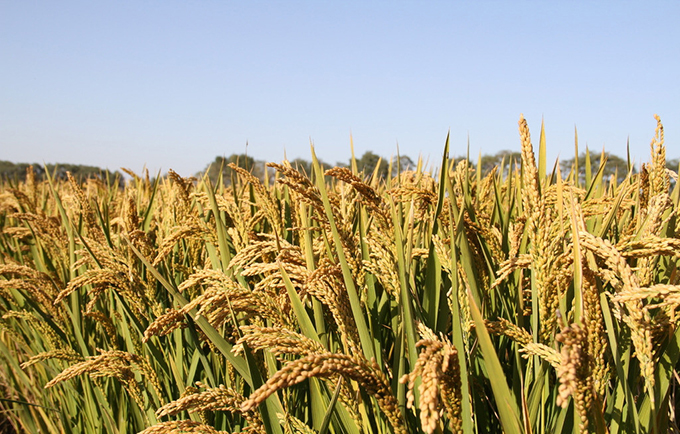
1. To assess the impact of various phosphorus fertilizers on the growth of rice.
2. To examine the effect of different phosphorus fertilizers on the cadmium content in rice.
3. To observe the influence of calcium oxide topdressing on rice growth and cadmium content in rice.
lThe experiment was conducted in Shigu Town and Shuangsheng Town, located in Sichuan Province, with slightly acidic sandy loam soil.
lThe study was carried out from May 2016 to October 2016.
lThe fertilizers used in the experiment included ammonium polyphosphate, potassium pyrophosphate, diammonium phosphate, and a control group treated with 20-10-15 compound fertilizer (potassium sulfate type).
l The rice paddies were divided into seven plots, each with a separate regular fertilization control. The nutrient amounts applied were N 10 kg/acre, P2O5 5 kg/acre, and K2O 7.5 kg/acre.
l Fertilization was performed by spreading the fertilizers before transplanting, with different types of phosphorus fertilizers applied based on specific treatment requirements.
Key findings of the study are:
l Alkaline phosphorus sources, namely DAP, APP, and PP, demonstrated a significant increase in rice yield. However, further verification is needed to confirm this phenomenon.
l The highest yield increase observed was 30% with potassium pyrophosphate (30%), followed by ammonium polyphosphate (22%) and diammonium phosphate (14%).
l The impact of alkaline fertilizers on reducing cadmium (Cd) content in rice remains inconclusive. Additional verification is required to draw definitive conclusions.
l In some fields, alkaline fertilizers were able to reduce Cd content, with the most substantial reduction being 40% (from 1.2 ppm to 0.7 ppm).
l Calcium oxide did not have a significant effect on increasing yield. However, it showed a notable ability to reduce cadmium content in rice.
l Treatment with calcium oxide in two fields resulted in a reduction of approximately 20% in cadmium content (from 1.1 ppm to 0.8 ppm).
Table: Nitrogen, phosphorus, and potassium fertilizer types and contents used in lettuce fertilization treatment in the field experiment.

The objectives of this study were:
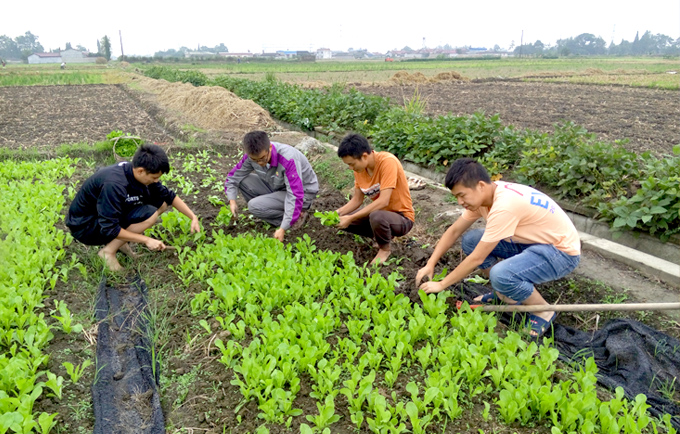
1. To assess the effects of different phosphorus fertilizers on the growth of Chinese lettuce.
2. To mitigate phosphorus fixation and loss and improve the utilization rate of phosphorus fertilizers during the season.
l The experiment was conducted in Shigu Town, Sichuan Province, using slightly acidic sandy loam soil.
l The study was carried out from September 2016 to November 2016.
l Phosphorus fertilizers used in the experiment included ammonium polyphosphate, diammonium phosphate, and ammonium phosphate (monobasic) as the control group.
l The Chinese lettuce experiment consisted of eight treatment groups, with a planting distance and row spacing of 875px and 5442 plants per acre. The seedlings were approximately 25 days old at the time of transplanting.
l Fertilization was performed in three stages: 20% of the total fertilizer was applied 10 days after transplanting, 40% was applied 19 days after transplanting, and the remaining 40% was applied by broadcasting 250px away from the roots of the Chinese lettuce 26 days after transplanting.
Table: Types and contents of nitrogen fertilizer, phosphorus fertilizer and potassium fertilizer used in fertilization treatment of lettuce in field experiment
Sample Name | N(kg/0.165 acre) | P2O5(kkg/0.165 acre) | K2O(kg/0.165 acre) | Source of Nitrogen | Source of P2O5 | Source of K2O |
NK | 15 | 0 | 12 | urea | 无 | NOP |
NK-MAP | 15 | 5 | 12 | urea | 11-44-0MAP | NOP |
NK-APP-2 | 15 | 5 | 12 | urea | APP | NOP |
NK-APP-1 | 15 | 2.5 | 12 | urea | APP | NOP |
NK-PP-2 | 15 | 5 | 12 | urea | KPP | NOP |
NK-PP-1 | 15 | 2.5 | 12 | urea | KPP | NOP |
NK-DAP-2 | 15 | 5 | 12 | urea | 21-53-0DAP | NOP |
NK-DAP-1 | 15 | 2.5 | 12 | urea | 21-53-0DAP | NOP |
Results
Key findings of the study are:
l APP exhibited slow growth in the early stage but experienced rapid growth during the fleshy enlargement period. It resulted in a 43% increase in yield compared to MAP. Even with a 50% reduction in usage, APP still achieved a 32% yield increase, outperforming PP (27%).
l DAP displayed vigorous growth in the early stage and achieved a yield comparable to that of APP. However, a 50% reduction in usage only resulted in a 13% increase in yield, significantly lower than that of APP.
Chart: Output of Chinese Lettuce under Different Measures of Fertilizing
Sample Name | Plant Number Per 0.165 Acre | Output per 0.165 Acre | Output Increasing Rate to NK | Output Increasing Rate to NK-MAP |
NK | 5442.000 | 2383.596d | / | -0.029 |
NK-MAP | 5442.000 | 2454.342d | 0.030 | / |
NK-APP-2 | 5442.000 | 3515.532a | 0.475 | 0.432 |
NK-APP-1 | 5442.000 | 3237.99ab | 0.358 | 0.319 |
NK-PP-2 | 5442.000 | 3123.708b | 0.311 | 0.273 |
NK-PP-1 | 5442.000 | 3118.266b | 0.308 | 0.271 |
NK-DAP-2 | 5442.000 | 3580.836a | 0.502 | 0.459 |
NK-DAP-1 | 5442.000 | 2786.304c | 0.169 | 0.135 |